

Bitcoin Is Repeating Its Bear-Market Transition Pattern
A Multi-Cycle MACD Analysis and Price Outlook for 2026
Bitcoin does not crash randomly.
When it enters a bear phase, it does so with structure, rhythm, and repetition.
The charts you’re looking at are not cherry-picked. They span multiple cycles and all show the same sequence:
Momentum peaks
Distribution begins
MACD rolls over decisively on higher timeframes
Price bleeds into a long compression phase
Only later does a durable bottom form
Let’s break this down carefully.
The Current Setup (2025–2026): Momentum Has Broken
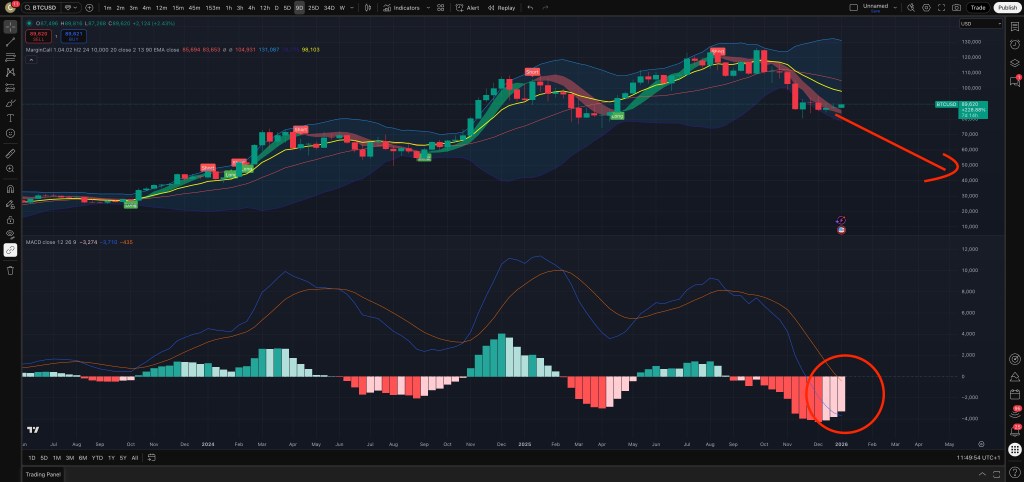
What matters most in the first chart is not the arrow.
It’s the MACD structure.
Histogram is deeply negative and still expanding
MACD and signal line are diverging downward
No flattening yet
No bullish divergence
This is not what a bottom looks like.
This is what trend continuation looks like.
Price is already below short- and mid-term moving averages, volatility is expanding to the downside, and rallies are being sold quickly. That combination historically signals a transition phase, not capitulation.
The 2014 Analog: Fast Drop → Long Bleed
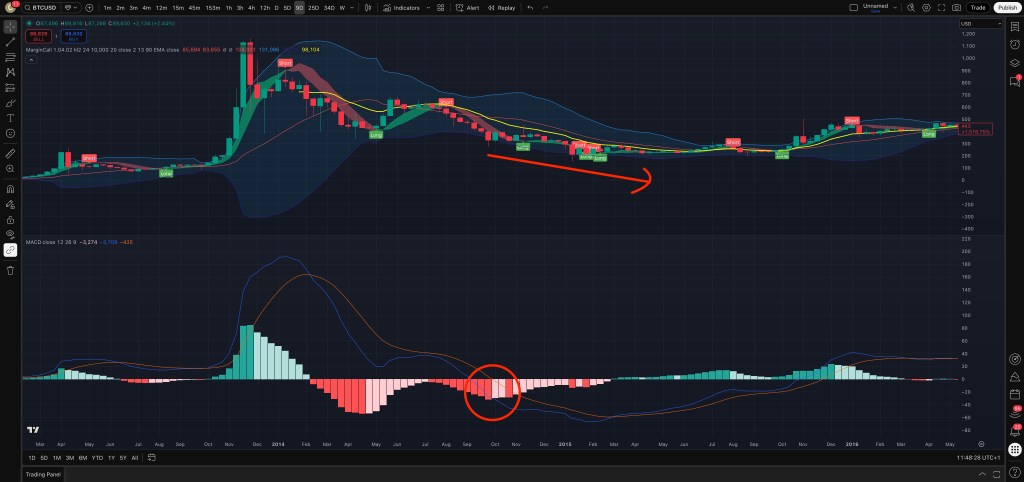
This is the most important comparison.
In 2014:
The first crash was violent
Then Bitcoin spent months moving sideways to down
MACD stayed negative but compressed close to zero
Price felt “boring” and “dead”
That period is psychologically brutal.
Most people exit there, not at the lows.
The current chart is not yet in that phase. It’s still in the momentum-unwinding stage.
The 2018 Analog: Capitulation Comes Later Than You Think

2018 is a reminder of something uncomfortable:
Bitcoin can look “cheap” and still drop another 50%.
In that cycle:
First drop looked like the bottom
MACD tried to stabilize
Price ranged
Then came a final flush
Only after that flush did:
MACD flatten
Histogram shrink consistently
Long-term accumulation begin
This is critical for expectations management.
The 2021–2022 Analog: Structural Deleveraging

The last cycle introduced a new element: leverage.
ETFs
Derivatives
Corporate treasuries
Retail leverage
That caused the drawdown to be slower but structurally similar:
Trend broke
MACD stayed negative for a long time
Recovery only began once liquidity conditions changed
Today, liquidity is not improving yet.
What This Really Means for Price
Let’s stop dancing around it.
High-Probability Scenarios (Next 6–12 Months)
Base case (most likely):
Gradual move into the $55k–$65k zone
Long consolidation
No V-shaped recovery
Bear case:
Loss of $55k
Test of $40k–$45k
Capitulation wick possible, not guaranteed
Bull invalidation:
Sustained reclaim of $100k+ on high timeframes
MACD flattening and turning positive
Liquidity expansion confirmed
Until that happens, rallies are counter-trend.
Why This Time Feels Different (But Isn’t)
You might be thinking:
“But there was no retail euphoria this time.”
Correct. And that’s why this is a structural bear, not an emotional one.
Institutions de-risk slowly
Leverage unwinds over months
Liquidity withdrawal doesn’t cause panic, it causes decay
That’s exactly what these charts show.
Final Takeaway
Bitcoin is not broken.
But it is digesting excess.
The MACD across cycles tells the same story every time:
Momentum dies first
Price follows later
Recovery takes patience, not hope
If you’re long-term bullish, this is not the time to chase upside.
If you’re managing risk, this is the time to respect the trend.
Markets reward those who survive the boring part.
Francesco Madonna – CEO @ https://www.bitvault.sv/