

Higher Timeframe Remains Bearish, Bull Trap
Bitcoin doesn’t produce infinite chart patterns.
On higher timeframes, it repeats a small number of structures again and again.
The charts show that this exact setup has only produced bull traps in Bitcoin’s history
The three charts below all show the same setup, appearing at different moments in Bitcoin’s history. And the important part is this:
Every single time Bitcoin printed this setup on a higher timeframe, the outcome was a bull trap.
No exceptions so far.
The setup (defined precisely)
Let’s define the structure clearly, because the claim only holds if the setup is the same.
Across all three charts, Bitcoin shows:
A sharp selloff that breaks the prior trend
Moving averages flatten or roll over.
Price stops riding the upper volatility band.
A strong rebound into the moving-average zone
Convincing green candles.
Short-term “long” signals appear.
Sentiment shifts from fear to relief.
Failure to reclaim the higher-timeframe MA bundle
Price stalls inside or just below the MA zone.
The MA zone acts as resistance, not support.
MACD improvement without regime change
Histogram contracts toward zero.
Momentum looks like it’s “turning.”
But it remains below zero and never expands positively.
That exact combination is the setup.
What happened historically when this setup appeared
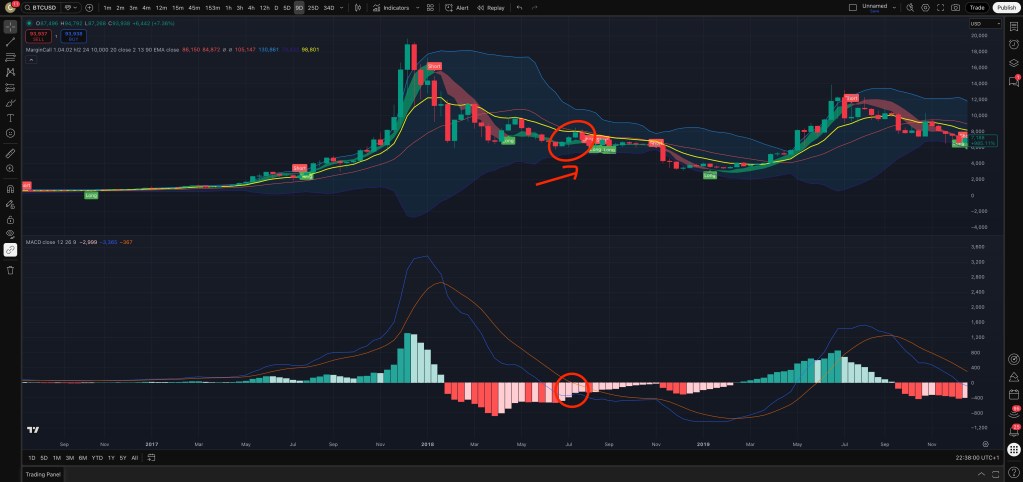
First occurrence (post-2017 peak)

Bitcoin sold off hard, rebounded into the moving averages, and printed improving MACD momentum. On the surface, it looked like stabilization.
Instead:
price failed at the MA ceiling,
momentum rolled back over,
the bear trend continued.
The rebound was a bull trap.
Second occurrence (post-2021 peak)
Different cycle. Same structure.
Breakdown from the top.
Strong rebound.
Rejection at the MA bundle.
MACD “healing” below zero.
Again:
no sustained reclaim,
no momentum regime flip,
continuation lower.
Another bull trap.
The current chart: same structure, same risk
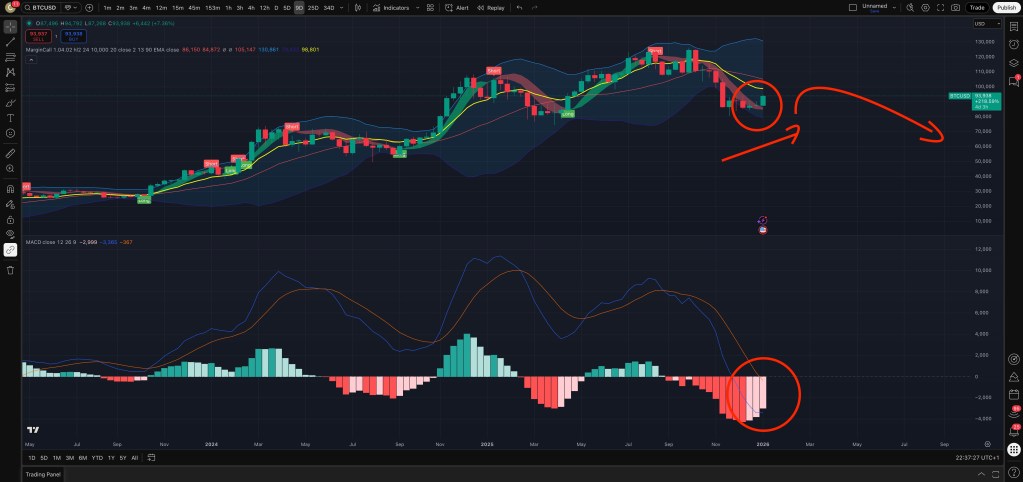
Now look at the current higher-timeframe chart.
It checks every box of the historical setup:
trend damage already done,
rebound into MA resistance,
no decisive reclaim of higher-timeframe structure,
MACD improving, but not flipping regime.
Historically, Bitcoin has never transitioned into a new bull leg from this configuration.
Every prior instance resolved the same way:
the rebound failed,
price rolled over,
downside resumed.
That doesn’t mean price must collapse immediately.
It means that the bounce itself is statistically suspect, because Bitcoin has not used this setup to start new bull markets.
Why this matters
This isn’t about calling a top or predicting exact levels.
It’s about recognizing that:
Bitcoin has a limited number of higher-timeframe transition patterns.
This particular pattern has only produced bull traps.
A different outcome would require a structural break from historical behavior, not just a strong bounce.
Until that break happens, the historical precedent is clear.
What would make this not a bull trap
If this time is different, it will be obvious in structure, not opinion.
Specifically:
a higher-timeframe close above the MA resistance zone,
sustained acceptance above it,
MACD transitioning into a positive regime,
moving averages flattening and turning up.
Until then, the setup remains the same one Bitcoin has already shown us twice before.
Francesco Madonna – Founder,CEO @ https://www.bitvault.sv/